HVS Image Morris water maze analysis gives you a clear, visual and quantitative readout of how directly your subject moved toward the goal. It calculates the percentage of the trial time and path spent within a straight “corridor” between the start point and the platform.
You can choose whether to include the corridor measure and, if so, how wide that corridor is – just set the width in the Advanced options in the Circular Mazes Analysis screen (the default value matches the platform diameter). A wider width will be more generous in how tightly the subject has to be to a direct path to be counted.
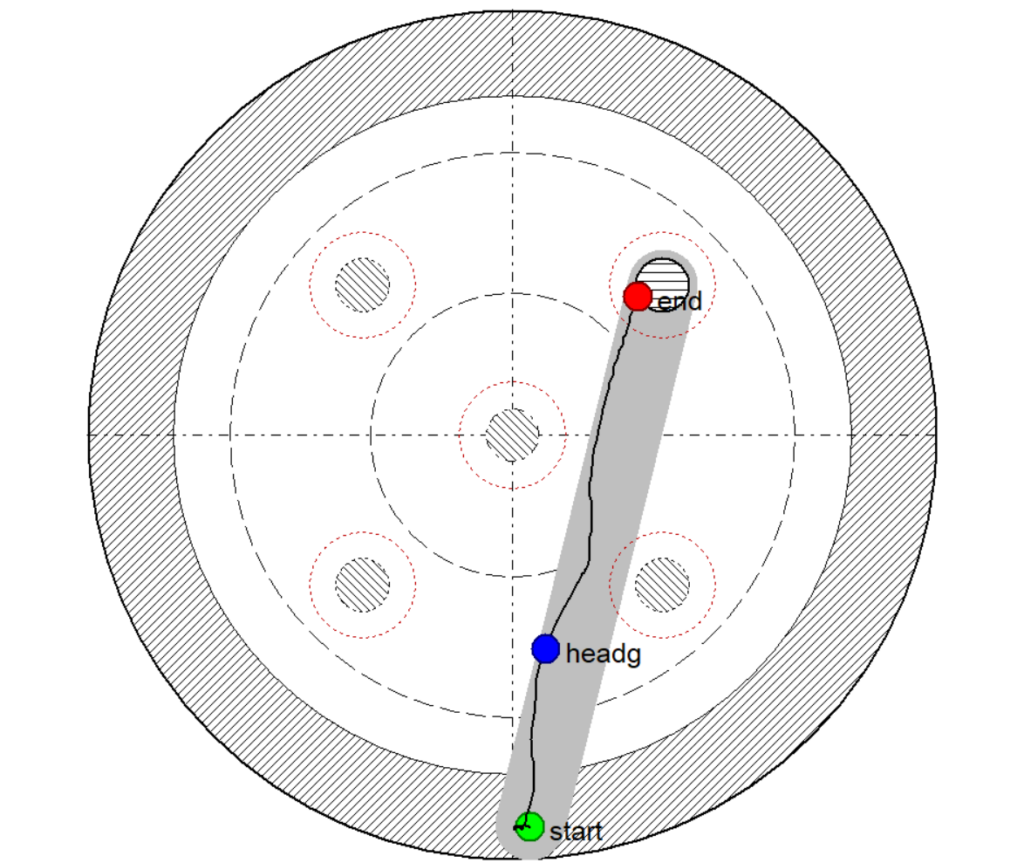
If you plot paths while the corridor test is selected, the corridor area will be shaded in grey, giving a clear indication of which parts of the path are included in your quantitative results – the percentage of the trial time and path spent in the corridor.
It’s a simple but powerful way to add clarity to your analysis:
– Was the subject heading with intent toward the platform location?
– Did they make a definite and close attempt, even if they missed the target?
– Are your treatment groups using different strategies, even if their latencies are similar?
As always with HVS, the corridor test is built in and easy to use – no extra software, scripting or setup is required.